AI-powered Optimization Platform
IonGenik is an advanced analytics platform that transforms raw data from the IonMetrik device into actionable insights.
A snapshot of your entire research pipeline.

The challenge
Growers produce food, not miracles.
Demand climbs, inputs get more expensive, and the weather cooperates less every season.
It starts at the seed
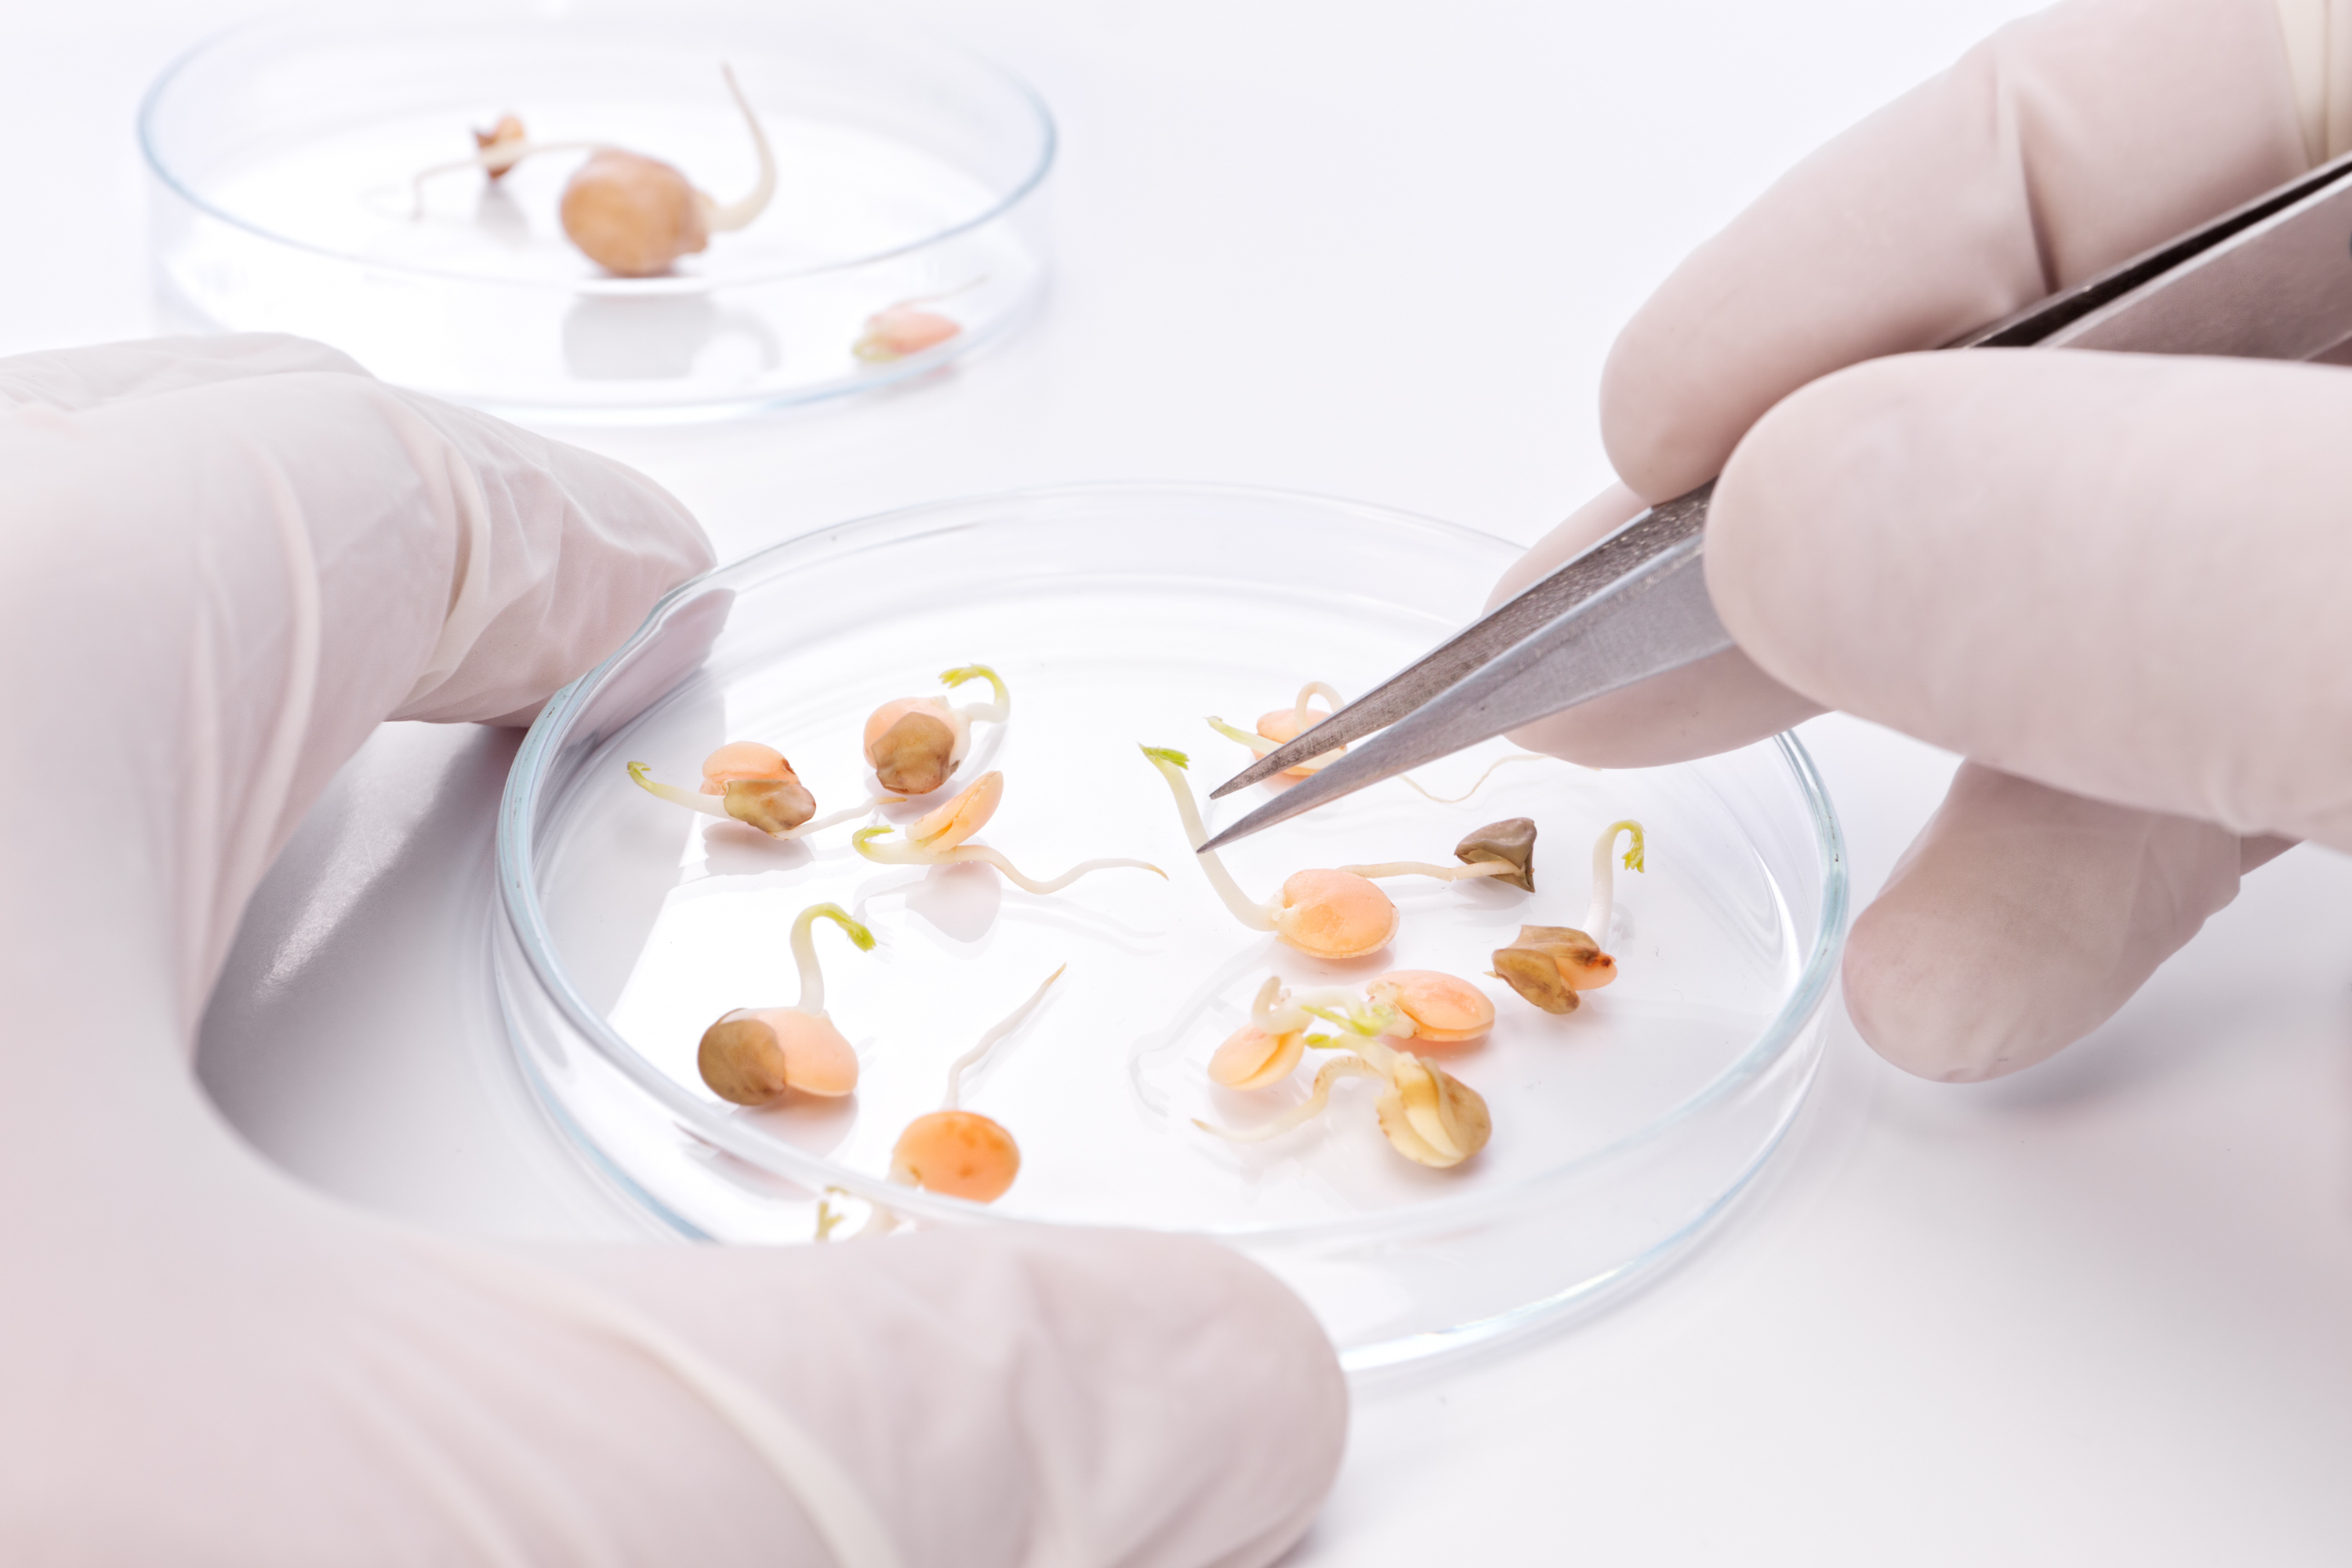
A seed that emerges late, unevenly, or not at all costs the season. Coat permeability, dormancy, and viability set a ceiling on everything downstream — transplant timing, tray utilization, and the margin on every square foot you committed months ago.
Testing what actually works on a given variety is slow, and most trials still live in spreadsheets, shared drives, and someone's memory of last year's protocol. By the time the pattern is clear, the planting window may already have closed — and buyers, regulators, and lenders increasingly want documented results rather than assurances. A treatment that can't be traced from seed lot to observed outcome is harder to scale, harder to defend, and harder to repeat when the person who ran the trial moves on.
The numbers
- Projected growth in global food demand by 2050 (FAO)
- +54%
- of producers name input costs as the top threat to profitability (McKinsey, 2024)
- 48%
The solution
Stronger seeds start with better evidence.
Bleiz pairs seed treatment equipment with the research platform that tells you whether it worked. IonMetrik treats the seed. IonGenik measures what happens next — on your varieties, in your conditions, with a record you can hand to anyone who asks.
Fewer cycles to an answer
Structure a trial once and stop re-deriving the same conclusion every season.
Less waste per trial
Plan around what you have already learned instead of repeating it.
A record that holds up
Every observation timestamped and attributable, available when someone asks how you know.
See how a trial is set up in IonGenik. Request a demo
Why now
From the research bench to the production line.
The window is open for teams that can document what works.
IonGenik is built for teams working where seed science meets crop performance — whether you are validating a treatment on four cultivars or standardizing one across a production program.
Agriculture is being asked to increase output, cut inputs, and absorb a changing climate at the same time. The teams that can prove what works — quickly, and in a form someone else can check — will set the pace.
Who this is for
Biopterre
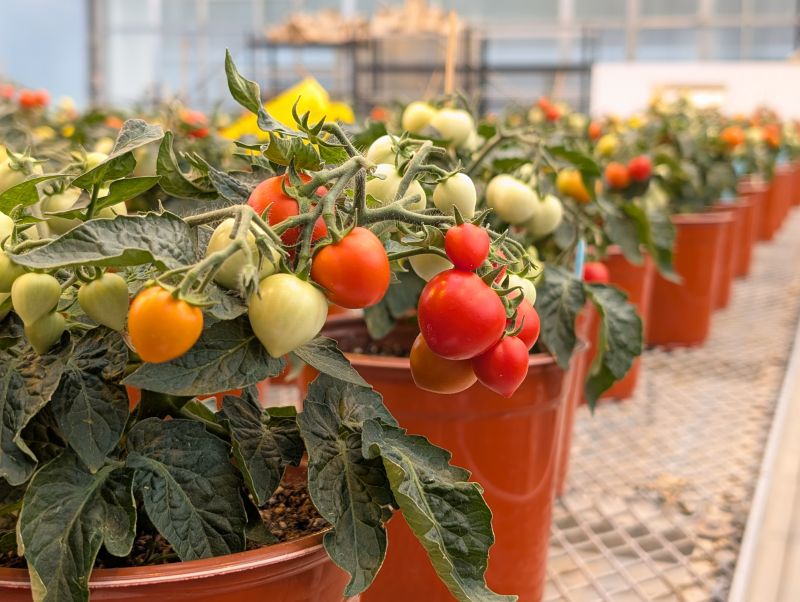
Tomato transplants from our first independent trial.